

Behind every Health Roundtable feature is a team of curious minds asking the right questions, connecting the dots, and turning complex data into something that truly matters.
As part of our celebration of Women and Girls in Science, we’re shining a light on the women behind the data at Health Roundtable - the analysts who quietly power the insights used by clinicians, health leaders, and organisations across the sector.
In this series, we’ll be sharing the stories, experiences, and day-to-day realities of the women working in data and analytics at Health Roundtable. From untangling governance questions and improving reporting, to building insights that support better decision-making, their work plays a critical role in how health data is understood and used.
First up, we’re introducing two of our data specialists: Jen Hyland, Senior Analyst – Data Governance (and her feline co-conspirator, Pinkie), and Josephine Tjeng, Analyst Programmer. Their paths into analytics may have been different, but they share a passion for turning complex data into clear, meaningful insight - and for making an impact where it counts.
Name: Jen Hyland (and co-conspirator Pinkie)
Role: Senior Analyst - Data Governance
Years at Health Roundtable: 4 years officially on the books, plus many years prior as a quiet observer, enthusiastic admirer, and occasional silent stalker of all things HRT. Before I was employed, I was introduced to Health Roundtable through the clinicians I worked with, some of whom literally carried a printed page from an HRT report in their pocket because they wanted that level of insight at their fingertips. During that time, I was also on the other side of the fence as a data submitter to HRT, which gave me a very practical appreciation of how the data was used and why it mattered.
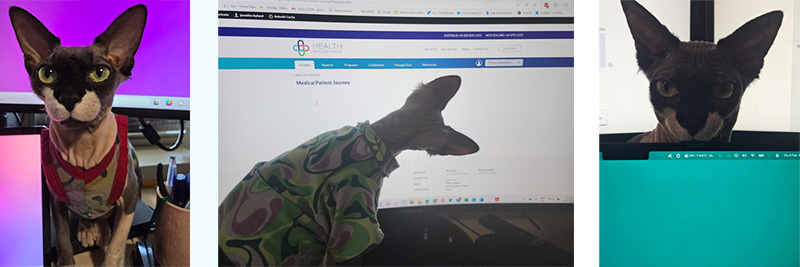
What does a typical day for you? There is no such thing as a typical day, which is probably part of the appeal. My time can involve wrangling data, untangling governance questions, maintaining structure and ensuring a whole picture is taken into account before decisions are made, translating between technical, clinical, and “what do you actually want?”, and gently preventing chaos before it becomes visible. It often includes advising on design and structure, sanity-checking ideas, documenting decisions so they are not lost to history, and helping teams navigate what is possible versus what is sensible. Also included are meetings, documentation, more meetings, and the occasional moment of quiet reflection when someone asks, “can’t we just change it?”
Why did you pick a career in analytics/ data science?
I did not so much pick analytics as narrowly escape into it. At the time, my boss decided I was getting bored and over-analysing things, such as work logs tracking how many trees were being cut down across NSW, when my actual task was simply data entry. Analytics was deemed the lesser evil and here we are.
My tendency to analyse shows up in everything I do and has even extended to analysing my son’s sleep patterns, which may or may not have contributed to my return to work from maternity leave.
Health analytics specifically came about thanks to a good friend who sent me a job ad with the words, “This is you.” They were correct. Alarmingly so.
What excites you about your job/ career?
Being able to channel my tendency toward perfection, my curiosity, and my personal experience in health and disability into something that genuinely makes an impact. The technology available in today’s world of data and analytics makes the possibilities feel almost endless and continues to expand what we can ask, explore, and uncover.
Health data is vast and honestly, we are barely scratching the surface. I am excited by the idea of moving beyond what is immediately visible and uncovering the complex worlds that exist beneath it. That is where the good stuff is.
Name: Josephine Tjeng
Role: Analyst Programmer
Years at Health Roundtable: 6 years
What does a typical day for you?
I usually start early around 7:30am to 8am, catching up on emails and messages before the day starts. My typical day can vary quite a bit, but usually include a stand-up call with the team, checking and responding to client queries, and working on the tasks in the current work sprint. That includes fixing bugs, improving existing reports/insights, or developing a new report/insights. Somewhere in between all of that, I am also getting mildly annoyed by my cat.
Why did you pick a career in analytics/ data science?
I've always loved working with numbers and creating pretty charts. I just find it satisfying on how the numbers and data that is messy and complex can be turned into clear and meaningful insights, especially when that helps someone to make a better decision. It's a mix of problem-solving, creativity, and logic, which always keeps things interesting.
What excites you about your job/ career?
Turning data into something useful! Whether that is a pretty dashboard or even a simple table that can make things clearer for someone to make a decision. It is just rewarding that my work make an impact. Analytics also keeps growing and evolving, there is always something to learn, such as a better way to visualise the data or better solution to a problem.